
Contents
Real-time data GPS route navigation Climb profile & data ANT+™ and BLE sensor support Strava (Live Segments) and TrainingPeaks Workouts Auto pause Battery management Data typesReal-time data
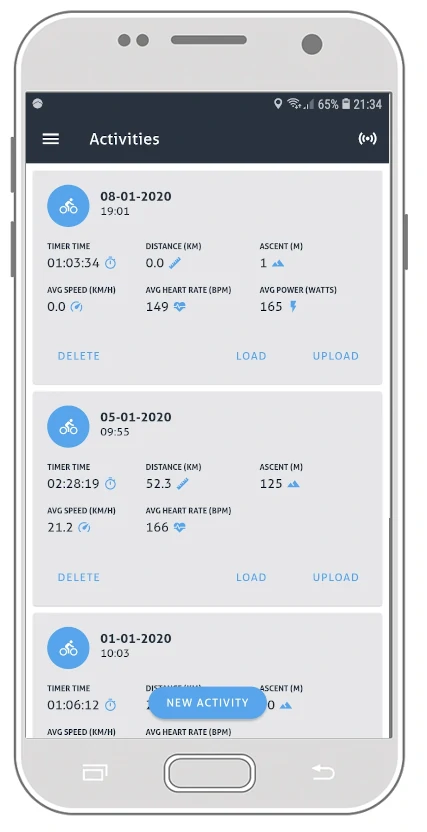
Jepster provides real-time performance data of your ride. Jepster supports multiple pages which are customizable such that you can have all the information that interests you displayed.
- Statistics: up to 16 editable data fields
- Summary: up to 16 editable data fields
- Lap statistics: up to 16 editable data fields
- Lap summaries: predefined with 9 data fields per lap
- Map & statistics: up to 16 editable data fields
- Elevation: up to 16 editable data fields
- Climb: up to 16 editable data fields
- Elevation chart: up to 16 editable data fields
- Speed chart: up to 16 editable data fields
- Heart rate chart: up to 16 editable data fields
- Power chart: up to 16 editable data fields
Your ride data will be stored on your smartphone as a FIT file.

GPS route navigation
Load GPX tracks or Strava routes (Strava premium members only) which will be shown on the map such that you can easily follow your route (no turn by turn navigation). You can choose to either use Google Maps or OSMdroid (OSMdroid supports offline maps).
Jepster provides you two different pages with a map:
- STATISTICS & MAP: a section with up to 16 editable data fields and a section with a map
- MAP: only a large map

Climb profile & data
Routes with elevation data will be analyzed and the climb profile will be visible when you are close to (less then 500m) or on the climb.
A climb has to contain at least a part with an average grade of 3% over 500 meters. It can have a small decline (average grade of a part with a decline has to be at least -0.5% over 1.500 meters).
Note: algorithm may be adjusted in the future or flexible based on terrain (different parameters for e.g. a hilly route vs. a mountain route).
Based on the climb the following data fields are available on every page:
- Distance to top
- Average grade of climb section
(sections are 250m, 500m or 1.000 meters depending on length of climb)
Jepster provides one page with the climb profile:
- CLIMB: a section with up to 16 editable data fields and a section with the climb profile, average grade of climb, distance of climb and average grade of climb section
Note that the size of the chart on depends on the number of data fields chosen.

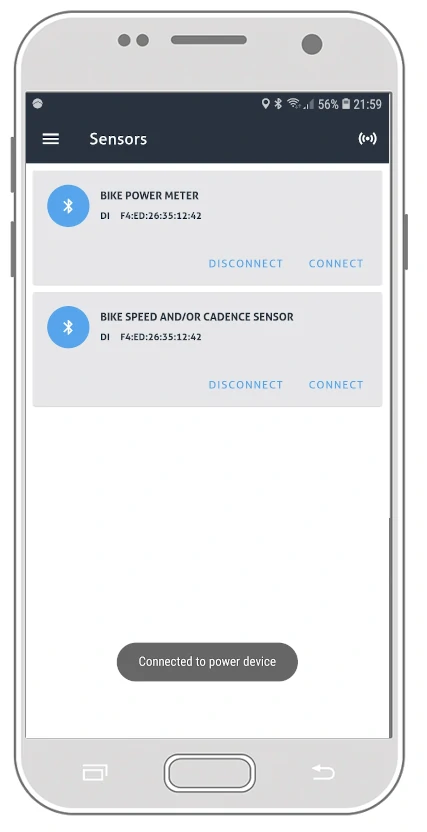
ANT+™ and BLE sensor support
Jepster supports ANT+™ and BLE sensors. Almost all phones do support BLE, but only a few do support ANT+™. On the ANT+™ website you can find more information about ANT+™ in phones. The following sensor types are supported.
- Heart rate
- Speed and/or cadence sensors
- Power sensors
Strava (Live Segments) and TrainingPeaks
You can connect Jepster to your Strava and TrainingPeaks account such that you
can upload your activities directly from Jepster to Strava and/or TrainingPeaks.
You can also download your planned bike workouts from TrainingPeaks (workouts planned up to 7 days ahead).
If you are a premium Strava member you can also download your
routes, load the track and your starred Strava Segments on the map. Check the Strava Live Segments manual for more information (implementation somewhat different compared to other implementations.)
Workouts
You can download your planned bike workouts from TrainingPeaks (workouts planned up to 7 days ahead) or load a Zwo (Zwift Workout) file. Jepster will give you a written and visualized overview of the workout and provide you with real-time information about the duration left and your current power compared to the lower and higher targets (heart rate limits can also be shown).
Jepster will automatically start the workout when the activity is started and start a new lap when the next workout step starts.
A workout can be paused or the steps duration time can be adjusted. Furthermore the power target can be adjusted.
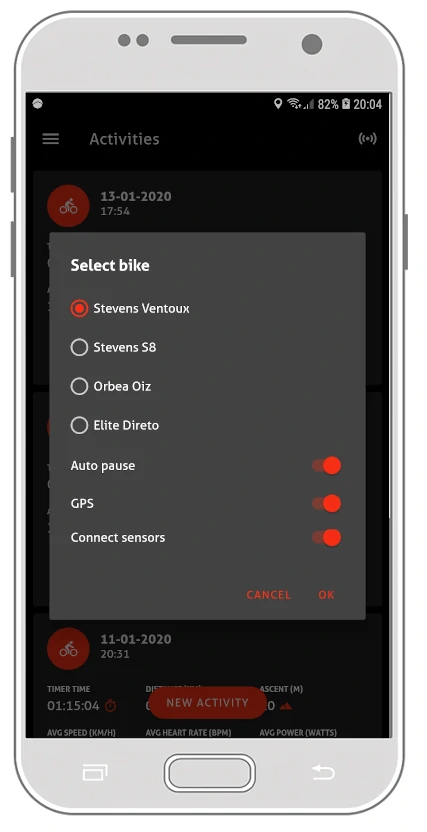
Auto pause
Auto pause feature to automatically pause your activity when stopped riding. You can choose the auto pause trigger value between 0 - 4,5 km/h.
Battery management
Jepster is designed to reliable log your ride data (your ride data is logged every second). But, on the other hand, to optimize battery usage. Main features to optimize battery usage:
When riding in dark mode with a Samsung S7 and screen brightness on ~75% my battery last up to 8 hours. When I navigate (so showing a map all the time with a route) the battery last up to 6 hours (in dark mode and screen brightness on ~75%).

Data types
The following data is available to be displayed:
| Data type | Fields (format) |
|---|---|
| Altitude |
Altitude (m or ft)
Gradient (%)(1) Ascent (m or ft) Descent (m or ft) Average grade section (%)(5) |
|
Cadence(2)
|
Cadence (rpm) Avg cadence (rpm) Max cadence (rpm) |
| Distance |
Distance (km or mi) Distance to start (km or mi) Distance to course (km or mi) Distance to end (km or mi) Distance to top (km or mi) (5) |
| Energy (8) |
Calories (KCAL) Work (KJoules) |
| GPS |
Bearing Latitude Longitude Start lat Start long GPS accuracy (m or ft) |
|
Heart rate(2)
|
Heart rate (bpm) Heart rate zone (1-5) Avg heart rate (bpm) Max heart rate (bpm) Heart rate (%max) |
|
Humidity(3)
|
Relative humidity (%) |
| Laps |
Lap ascent (m or ft) Avg lap cadence (rpm) Max lap cadence (rpm) Lap descent (m or ft) Lap distance (km or mi) Lap start lat Lap start long Avg lap heart rate (bpm) Max lap heart rate (bpm) Lap number Avg lap power (watts) Normalized lap power (watts) Max lap power (watts) Avg lap power (%FTP) Avg lap balance L - R (%) Avg lap speed (km/h or mph) Max lap speed (km/h or mph) Lap start time Lap timer time Lap time elapsed Total laps |
|
Other
|
Battery level (%) Bell Temperature (°C or °F)(4) |
|
Power(2)
|
Power (watts) Power 3 sec (watts) Power 30 sec (watts) Left power (watts) Left power 3 sec (watts) Left power 30 sec (watts) Right power (watts) Right power 3 sec (watts) Right power 30 sec (watts) Balance L - R (%) Balance L - R 3 sec (%) Balance L - R 30 sec (%) Pedal smoothness L - R (%) Pedal smooth. L - R 3 sec (%) Pedal smooth. L - R 30 sec (%) Power (%FTP) Power (watts/kg) Torque effectiveness L - R (%) Torque eff. L - R 3 sec (%) Torque eff. L - R 3 sec (%) Avg power (watts) Normalized Power® (watts) Avg balance L - R (%) Max power (watts) Intensity Factor® Training Stress Score® |
| Speed |
Speed (km/h or mph) Avg speed (km/h or mph) Max speed (km/h or mph) |
| Strava Live Segments(6) (Beta) |
Name Time elapsed Distance to start (m or ft) Distance since start (m or ft) Distance to end (m or ft) PR distance elapsed (m or ft) 2nd distance elapsed (m or ft) 3rd distance elapsed (m or ft) PR time delta 2nd time delta 3rd time delta |
| Time |
System time Start time Timer time Time elapsed Sunrise(7) Sunset(7) |
| Workouts |
Duration left Instruction Power Low | High Cadence |
1 only if your phone has a pressure sensor
2 only if you are using an ANT+™ or Bluetooth cadence / speed sensor or heart rate / power meter
3 only if your phone has a humidity sensor
4 only if your phone has a temperature sensor
5 only if you are riding a route with elevation data
6 only available when you have a Strava subscription
7 only available for Android 8 or higher
8 only available when you are connected to a power meter
Normalized Power® (NP®), Intensity Factor® (IF®) and Training Stress Score® (TSS®) are trademarks of TrainingPeaks, LLC and are used with permission. Learn more at http://www.trainingpeaks.com.